.png)
 1 month ago
31
1 month ago
31
Kevin PeacheyCost of living correspondent

 Getty Images
New numbers forecasting the state of the UK economy have been published alongside the chancellor's Spring Statement - shedding some light on prospects for you and your money.
Here are three figures from the government's official forecaster and what they could mean for your finances.
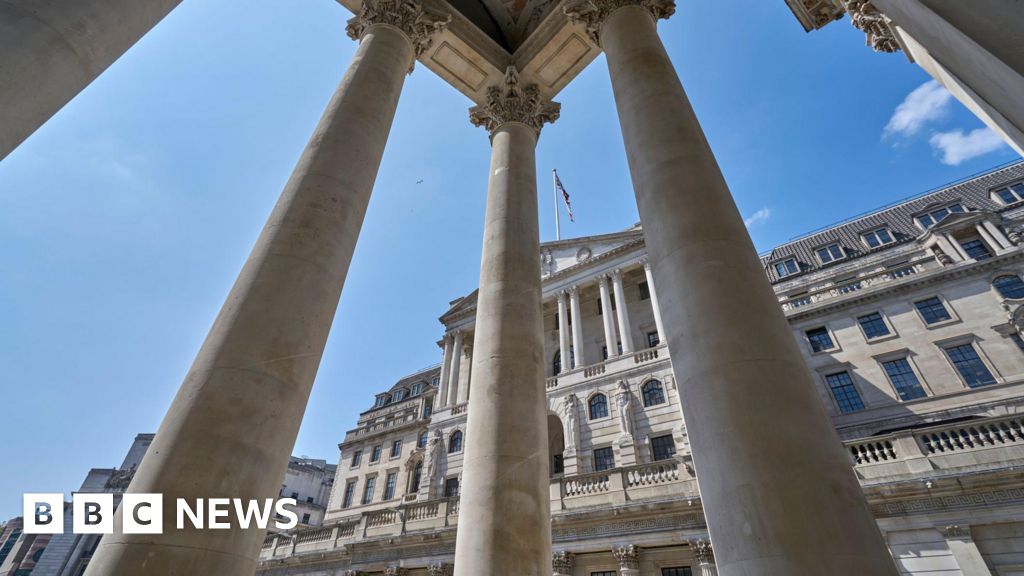
UK inflation - which charts the rising cost of living - is forecast to be at or around the target level of 2% over the next five years, according to the Office for Budget Responsibility (OBR).
This is a far cry from the peak in October 2022 when prices were rising at a rate of 11.1% a year. In January this year, the rate was still well above the target at 3%.
As a result, the Bank of England could well have been expected to lower interest rates. That would lower the cost of borrowing on mortgages and other personal loans, but also reduce the interest paid on savings.
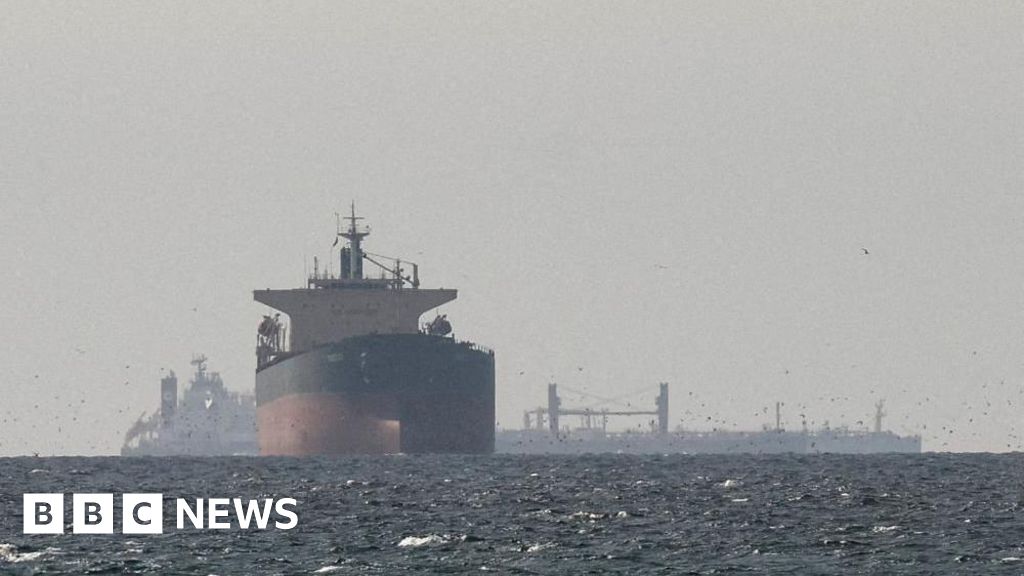
However, the impact on the price of, say, petrol owing to the US-Israeli war with Iran is not reflected in these forecasts. The numbers were crunched before the air strikes and escalation of the conflict.
Given the events in the Middle East in recent days, the trajectory of interest rates becomes more uncertain. It could even result in fewer interest rate cuts than previously expected, or even the chance of rate rises.
Average disposable income - which measures the amount of money people have left to spend after they have paid tax – will give us an indication of households' spending power in the coming years.
In short, it suggests how much better our living standards are going to get, stripping out the impact of rising prices.
Real household disposable income is expected to grow between 0.6% and 0.9% each year between 2026 and 2030.
When calculated per person, and in cash terms, then real household disposable income reached £26,300 in 2025 and is forecast to increase steadily to £26,900 in 2030.
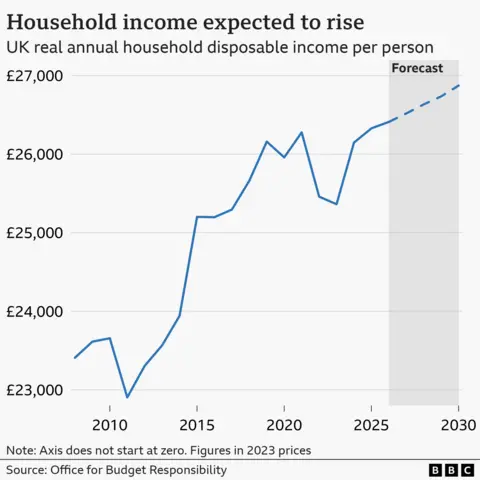
Following a boost during the first year after the election, growth will be slower, according to the forecasts.
The government's policy on tax thresholds - the point at which you start to pay tax, and the point where you tip into paying a higher rate of tax - has had an impact on this number. In last year's Budget, Chancellor Rachel Reeves said these would stay frozen until 2031. That is three years longer than previously planned.
This means any kind of pay rise could drag you into a higher tax bracket, or see a greater proportion of your income taxed than would otherwise be expected.
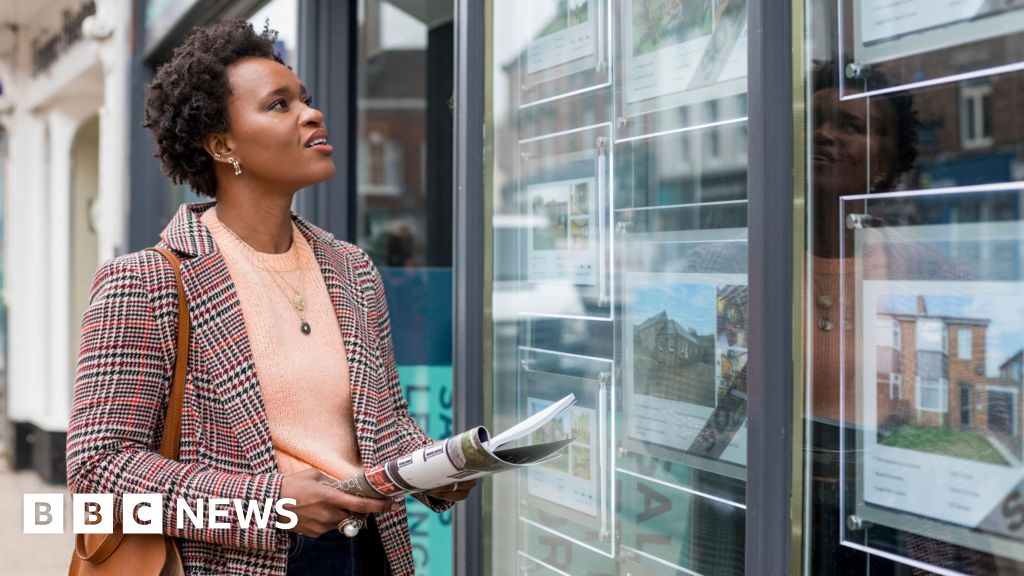
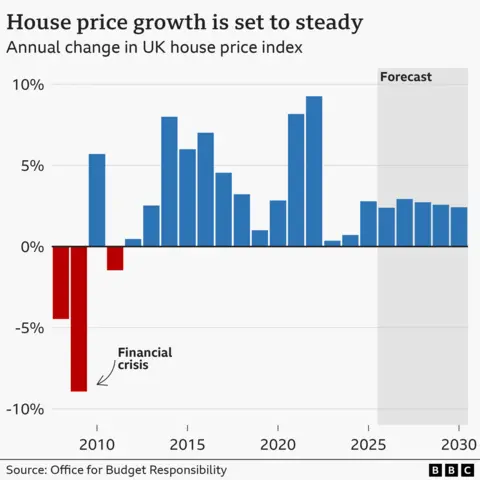
If you own your own home, or you are looking to buy one, you will have at least one eye on UK house prices.
Property prices have been relatively steady over recent months, although borrowing costs have been harder to predict.
House prices will rise between 2.4% and 2.9% each year between 2026 and 2030, according to the OBR.
That relative stability may give people the confidence to take time over buying and selling - although local housing markets often have their own dynamics.
The OBR said the average interest rate on mortgages was expected to rise from 4.1% this year to 4.5% on average each year from 2027 to 2030.
Competition between mortgage lenders for first-time buyers has intensified this year, as they offer bigger loans in comparison with people's income and require smaller deposits.
In turn, that has eased some of the pressure on the cost of renting.
However, that has come after rents for new tenancies soared since 2020. Our interactive graphic shows where the £1,000 a month rental zone has extended, principally from London. The average rent figures do not account for inflation.
Use the tool, using data from property portal Zoopla, to see how the cost of privately rented homes has risen in your council area in England, Scotland and Wales.
All these figures from the OBR are forecasts, so there is no guarantee that they will be accurate.
As with any forecasts, it would be dangerous to base any decisions about your own finances on these expectations, as they could be changed significantly by events.
Graphics by Tommy Lumby, Amy Jackson and Phil Leake